
The UK defence industry is a major contributor to the UK economy and is forecast to grow significantly in the coming years. But what do the numbers say, and what technology areas are seeing the most activity? The Joint Economic Data (JED) Hub has recently released the 2025 Annual Economic Report “Capturing and quantifying the contribution of the defence sector to the UK economy”. This article looks at some of the headline trends and conclusions from the report.
By way of introduction, the report is based upon data obtained using the 2024 JEDHub Industry Survey. The survey was answered by 16 of the UK’s largest defence firms (including BAE, Rolls-Royce and Qinetiq – full list at page 35 of the report). The 2024 survey primarily focussed on the 2022 and 2023 calendar years, and so the 2025 report is reflective of data during this time period. Important limitations to note are therefore: i) the data relates only to the UK’s 16 largest defence firms that responded to the survey; and ii) the data relates to 2022/2023 unless stated otherwise.
UK defence employment
At page 6 the report includes a figure (copied below as Figure 1) indicating the distribution of full-time employees across the UK in the defence industry (for the 16 firms that responded). The North West is home to the vast majority of employees across the respondents (with 24,200 employees), with the South East in second place (with 9,440 employees). This is indicative of the growing importance of the North West to the UK defence industry, with a number of large defence ‘primes’ having bases in the North West. I expect the North West will see further growth in the defence industry in the coming years. The proportion of employees in the South East is also no surprise given the presence of Airbus, BAE, Rolls-Royce and other defence firms in the region.
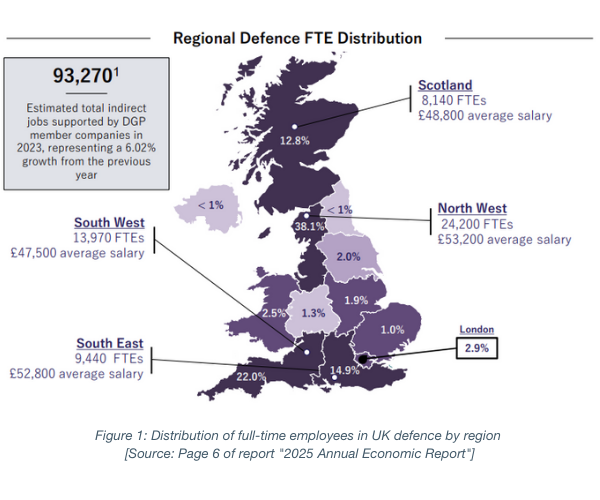
The report also notes a significant increase in employee numbers between 2022 and 2023 – an indicated 19.9% growth. As will be shown later in the article, this growth in employee numbers is also indicative of the growing revenues generated by the UK defence industry. Such growth in employee numbers and revenue is likely to continue for years to come, too, with growing political uncertainty in Europe and beyond meaning the UK defence industry is of critical national importance.
Value – International and domestic
At page 11 the report considers revenues generated by the UK defence industry. By way of headline numbers, revenue increased from £28.9bn in 2022 to £33.2bn in 2023 (a 15% increase). Expenditure on intermediate goods and services (e.g. supply chain) also saw a >30% increase, perhaps indicative of ongoing cost pressures.
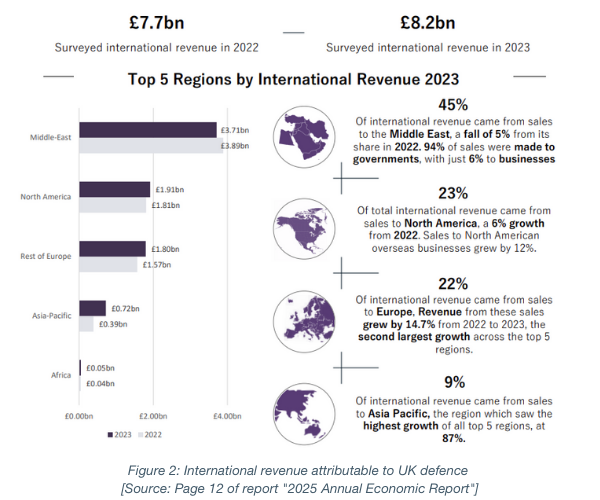
At page 12 the report includes a figure (copied below as Figure 2) illustrating international revenues generated by the survey respondents. Total international revenue is up from £7.7bn in 2022 to £8.2bn in 2023. The Middle East region is by far the largest contributor to these revenues, although Middle East revenue has decreased slightly (~5%) in 2023 relative to 2022. 94% of sales to the Middle East are to governments, a significant share. Exports to North America and Europe also saw growth between 2022 and 2023 (6% and ~15% respectively). I expect we will see continued growth of European exports, and possibly reduced growth of North American exports, in the future.
Domestic defence turnover also increased in 2023 (page 13 of the report), with a 15% increase on 2022. Domestically, the largest customer is the UK MoD ([Ministry of Defence] £14bn), but other government departments (£1.1bn), and industry or business-to-business sales (£0.9bn), accounted for a further £2bn in sales. The share of domestic turnover increased slightly from 2022 to 2023, too.
Value – Turnover by technology area
At page 14 the report considers defence turnover by capability, or technology, area, with a figure (copied below as Figure 3). Combat air turnover is the clear frontrunner, accounting for ~37% of total turnover with a total contribution of £7.7bn. A significant proportion of turnover from combat air sales is also international revenue (67%), indicative of the UK’s internationally leading reputation for air combat technologies. Based upon the numbers in the report, it seems likely that combat air sales will continue to see significant growth, particularly with the rapid development of drone technologies in recent years. Sub-surface maritime, as an area, also provides a significant contribution (~18%/£4.4bn), almost all of which is domestic revenue.
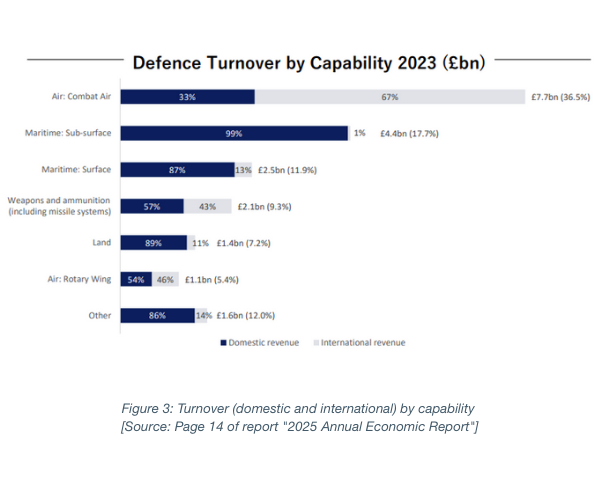
Although not shown in the figure, air combat sales reduced slightly between 2022 and 2023 (£0.2bn) whilst sub-surface maritime sales increased significantly by 15% (from £3.8bn to £4.4bn) in the same period.
R&D expenditure – Trends, funding sources and technology areas
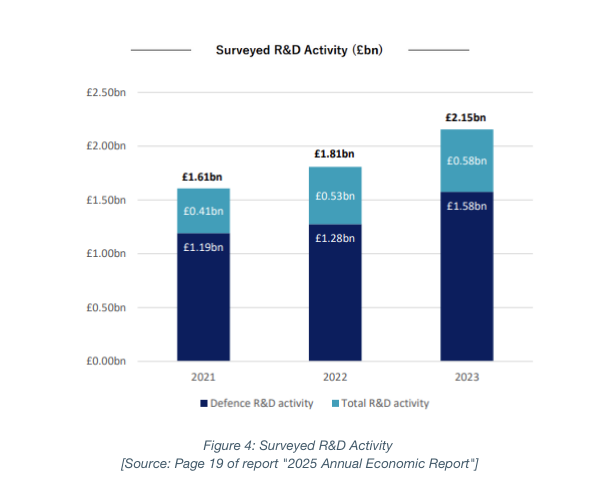
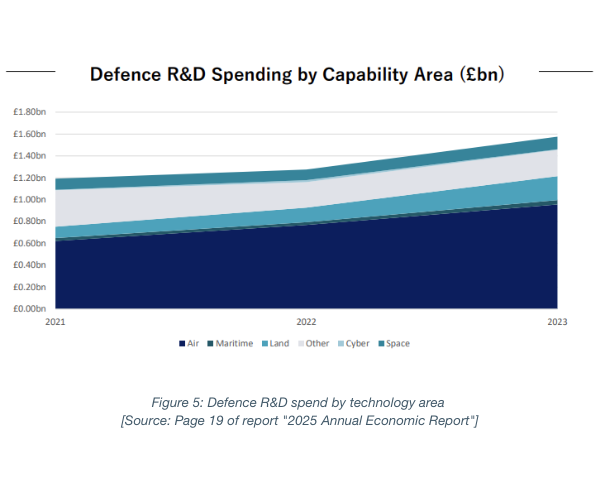
At page 19 the report considers Research and Development (R&D) expenditure by the respondents, for the period 2021-2023, with a figure (copied below as Figure 4). The figure shows a clear trend of increasing R&D expenditure, with the proportion attributable to defence R&D also significantly increasing year-on-year. Like any industry, R&D expenditure is critical to developing innovative technologies and capabilities, as well as improving existing ones. This trend of growing R&D expenditure is great to see and bodes well for the development of new technologies by the respondents. I expect R&D expenditure will continue to grow, despite cost pressures, in order for respondents to maintain their footholds in the defence marketplace.
Also of interest, page 19 of the report breaks down the funding sources of the R&D expenditure. The UK Government is consistently a significant provider of R&D funding to the respondents, providing a consistent share of ~63% of total expenditure. This is perhaps not surprising given the UK MoD is a significant customer to UK defence, and significant UK defence technology development is at the request of the UK MoD. Other funding sources include the respondents’ own funds (~21%), overseas sources (~10%) and other UK businesses (~5%).
At page 20 the report considers Research and Development (R&D) expenditure by the respondents, for the period 2021-2023, by technology area. As shown in Figure 5 below, R&D expenditure in air capabilities has seen significant growth but the most significant proportional growth is attributable to land vehicles (112% growth from 2021 to 2023).
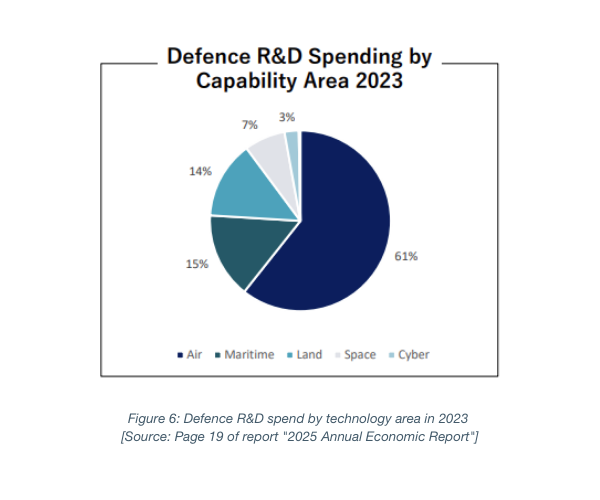
When 2023 is considered in isolation, the defence R&D spend by technology area is shown in the figure below. 61% is attributable to air technologies, maritime and land technologies have a roughly even share of ~14% each, space sees 7% and cyber technologies just 3%. I expect future reports will observe continued growth in air technologies, and we will see a growing importance in space, and cyber, defence technologies also.
Closing remarks
The report outlines an optimistic overview of the UK defence industry, for the respondents, across years 2022 and 2023. The defence industry provides a substantial number of jobs across the UK, with many in the North West. International and domestic UK defence revenues have seen growth, and will likely continue to experience growth with the uncertain political climates of late. Europe is a growing export region for UK defence technologies. Air combat is an area of strength and importance for the UK defence industry.
On the R&D front, general R&D, and defence R&D, expenditure is on an upward trajectory across the respondents. A significant share of R&D expenditure is funded by the UK MoD, indicative of government support across the UK defence industry. Air technologies dominate the R&D spend, but land vehicle and maritime capabilities have also seen growth.
Businesses operating in UK defence, and beyond, should continue to protect their valuable innovations from R&D investment by way of patent applications and other forms of registered intellectual property (e.g. design registrations, trade marks etc.).
Please do not hesitate to get in touch should you have any intellectual property queries relating to the defence sector or any other technology area.
 and European Patent Attorney, UPC Representative based in Marks & Clerk's Manchester, UK office. Mitch has particular experience in the fields of turbomachinery, manufacturing, automotive, aerospace, continuous inkjet printers, tires, sensing systems, consumer goods and general mechanical engineering.")
/Passle/6130aaa9400fb30e400b709a/SearchServiceImages/2026-03-30-09-41-31-861-69ca454b2a7335329c11003a.jpg)
/Passle/6130aaa9400fb30e400b709a/SearchServiceImages/2026-03-30-02-44-53-519-69c9e3a57e1ad88f144d506c.jpg)
/Passle/6130aaa9400fb30e400b709a/SearchServiceImages/2026-03-27-13-40-51-830-69c688e3ee1fac9224524932.jpg)